A risk register that scores, escalates and reports itself.
A risk register in a spreadsheet is out of date the day after you save it. Venvera scores every risk on a 5x5 matrix, draws your risk appetite straight across it, escalates automatically when a risk crosses tolerance, and generates the board view from live data - so the register is a working system, not a document someone updates twice a year.
The register is not the job. Keeping it true is.
Everyone has a risk register. Almost nobody has one that reflects reality. The scoring is inconsistent, the ownership is unclear, the escalation happens by email if at all, and the board sees a snapshot assembled by hand. The work is not writing risks down - it is keeping a current, scored, owned picture that the board and the regulator can both trust. Venvera makes the register live: automatic scoring, appetite thresholds, escalation triggers and quarterly snapshots for trend and audit evidence.
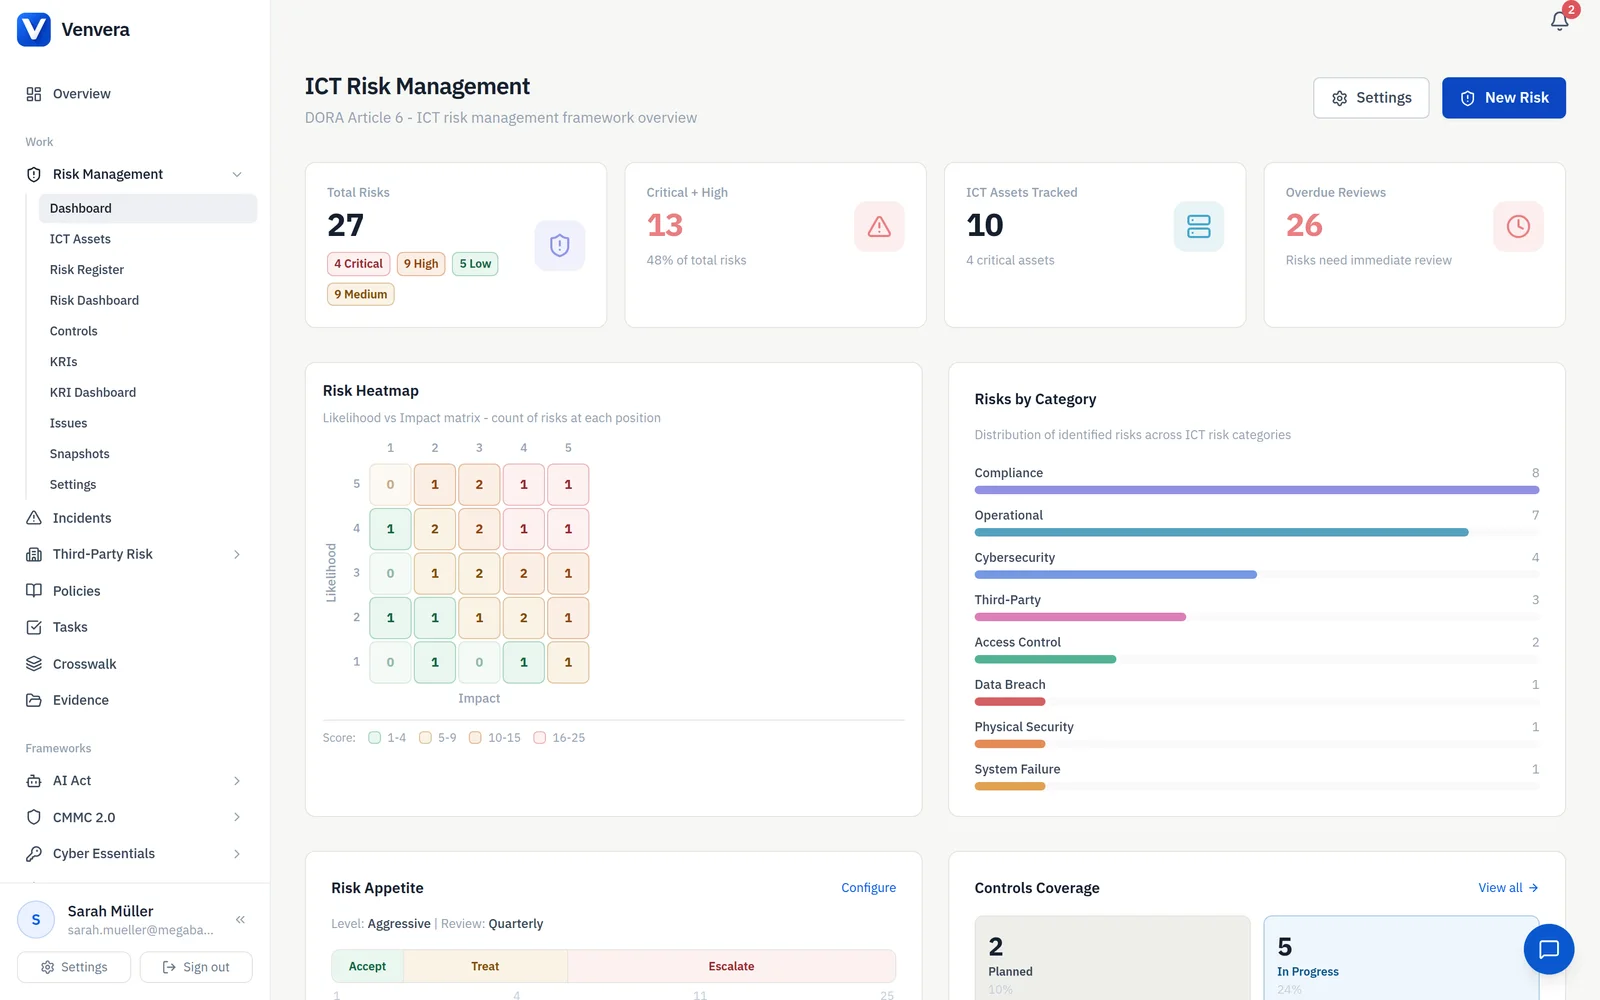
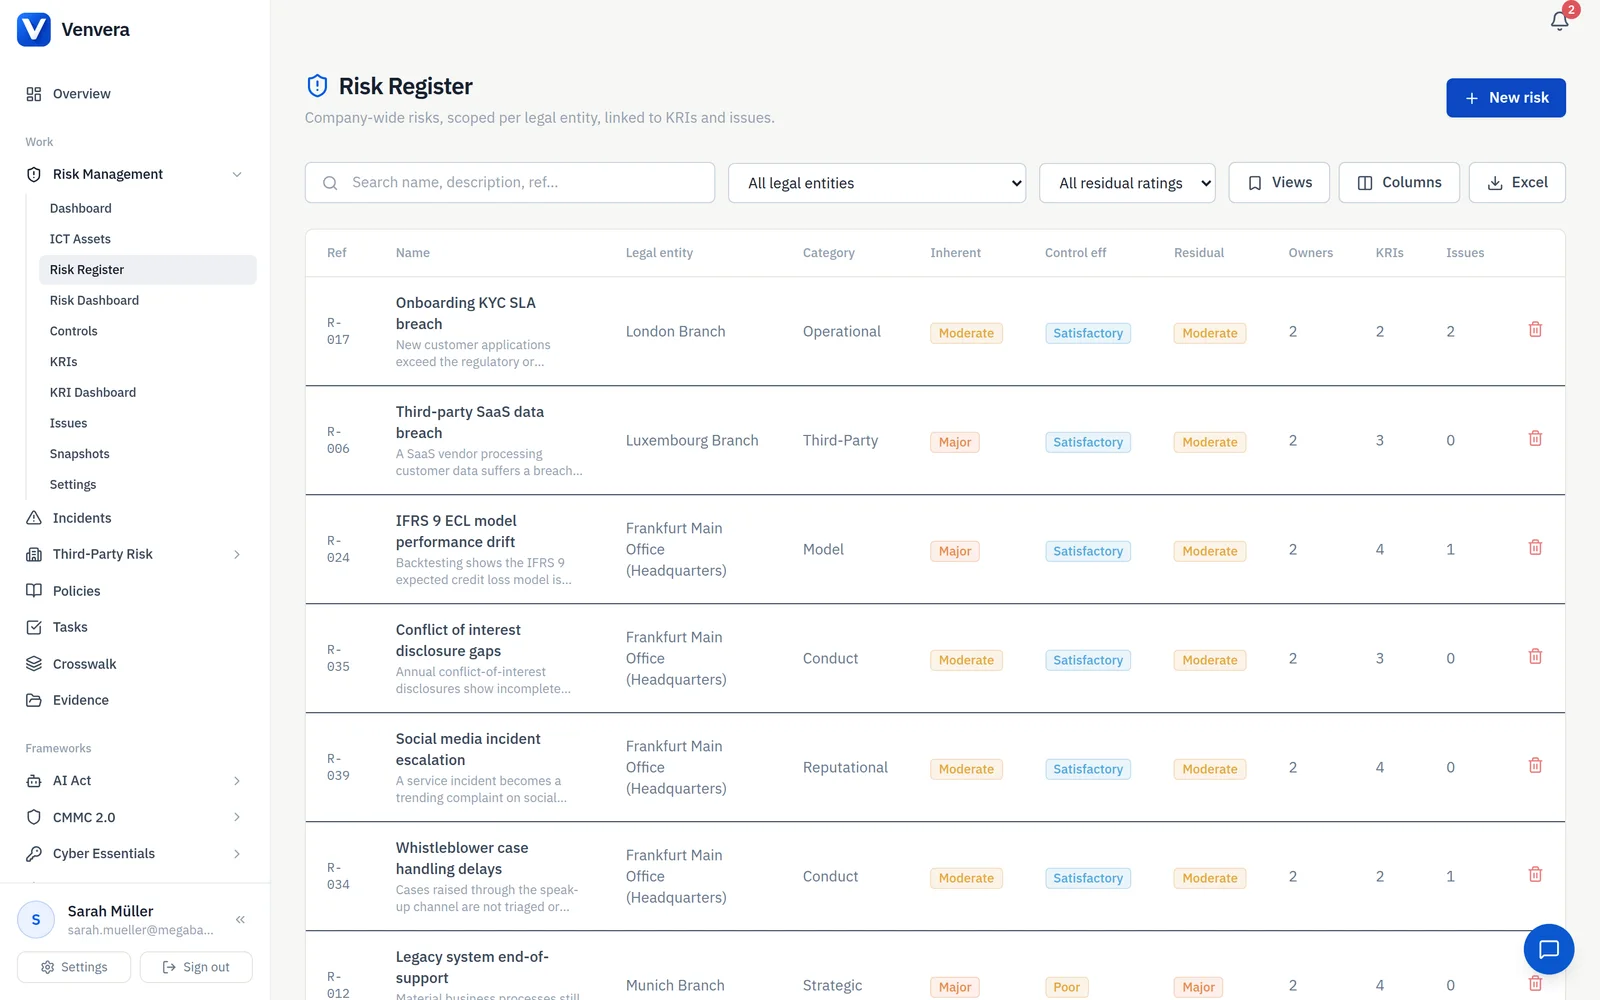
One register that scores every risk the moment you enter it.
Every ICT risk in one place. Title, threat source, vulnerability, likelihood and impact scoring on a 1 to 5 scale, and automatic risk level classification. Track treatment decisions (mitigate, accept, transfer, avoid, escalate), residual risk scores and review dates. Assign ownership so nothing falls through the cracks.
- 9 risk categories: operational, cyber, vendor, data, legal, strategic, compliance, physical, environmental
- 5-stage lifecycle: Identified, Assessed, Treatment Planned, Treatment Implemented, Closed
- Automatic score calculation (likelihood x impact = inherent risk)
- Risk ownership assignment with overdue review alerts
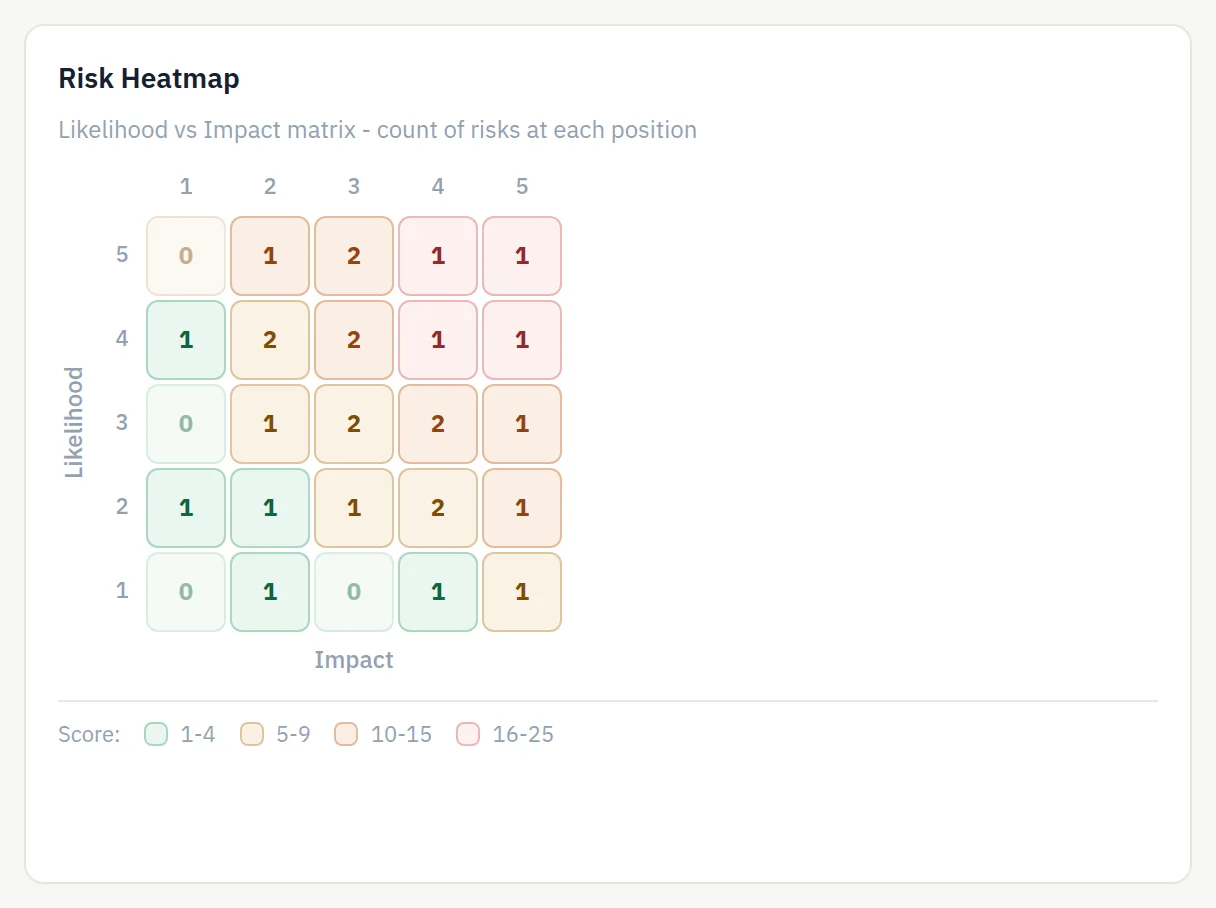
See where risk concentrates before it reaches the board.
A visual likelihood and impact matrix with color-coded severity zones from green through amber to red. Instantly spot where risks concentrate in critical zones. Click any cell to drill into the underlying risks. Board-ready visualization you can export or present directly.
- Color-coded 5x5 matrix (Low, Medium, High, Very High, Critical)
- Interactive: click any cell to view risks at that intersection
- Filter by category, owner, framework or treatment status
- Residual vs. inherent heatmap comparison view
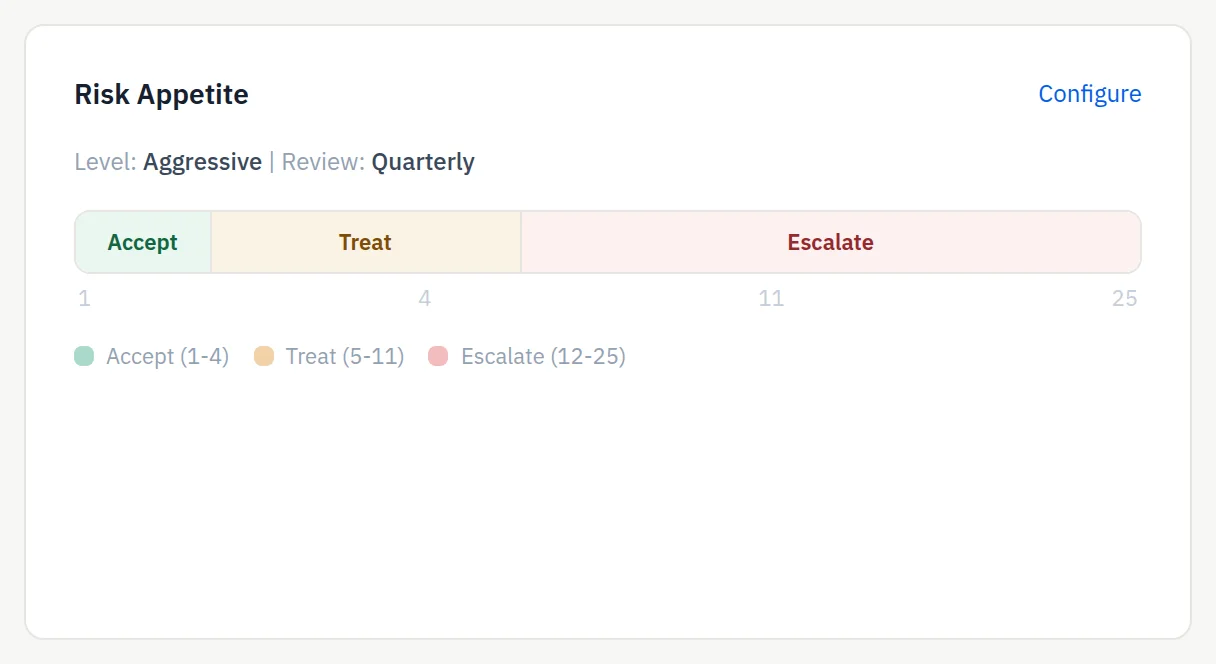
Escalate automatically when a risk crosses your appetite.
Define your organisation's risk appetite with clear thresholds. Risks below the acceptance threshold need no action. Risks above the escalation threshold trigger board-level review. The visual zone bar makes it instantly clear where every risk sits relative to your tolerance, eliminating ambiguity and missed escalations.
- Three zones: Accept (green), Treat (amber), Escalate (red)
- Configurable acceptance and escalation score thresholds
- Conservative, Moderate or Aggressive appetite presets
- CRO and board approval tracking with audit trail
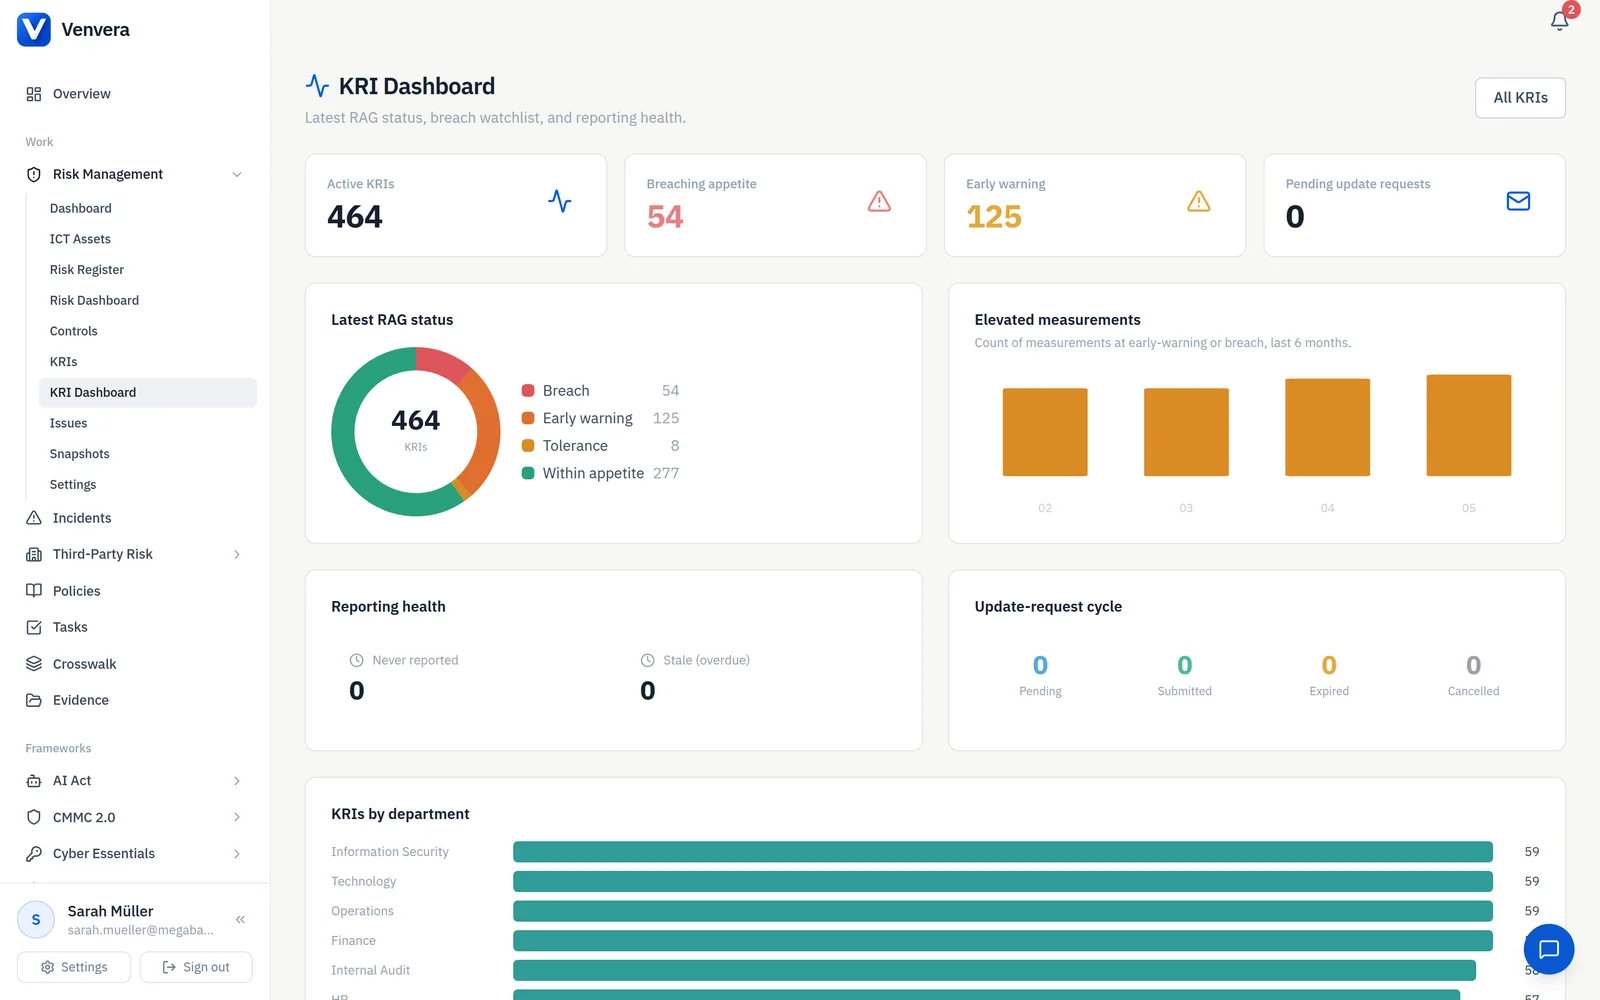
Catch a risk while it is still an early warning.
Define the metrics that warn you a risk is materialising before it becomes an incident. Each KRI has fully configurable threshold bands, a measurement history with a trend chart, and breach alerts to owners and subscribers. Request a reading from the owner with a single-use magic link, or let Venvera auto-compute the value from your own compliance data.
- Configurable 2 to 4 threshold bands, lower-is-better or higher-is-better
- Measurement history with trend chart and threshold boundary lines
- Breach alerts to owners and subscribers; single-use magic-link update requests
- Auto-computed KRIs from system data (control effectiveness, policies past review, vendor concentration)
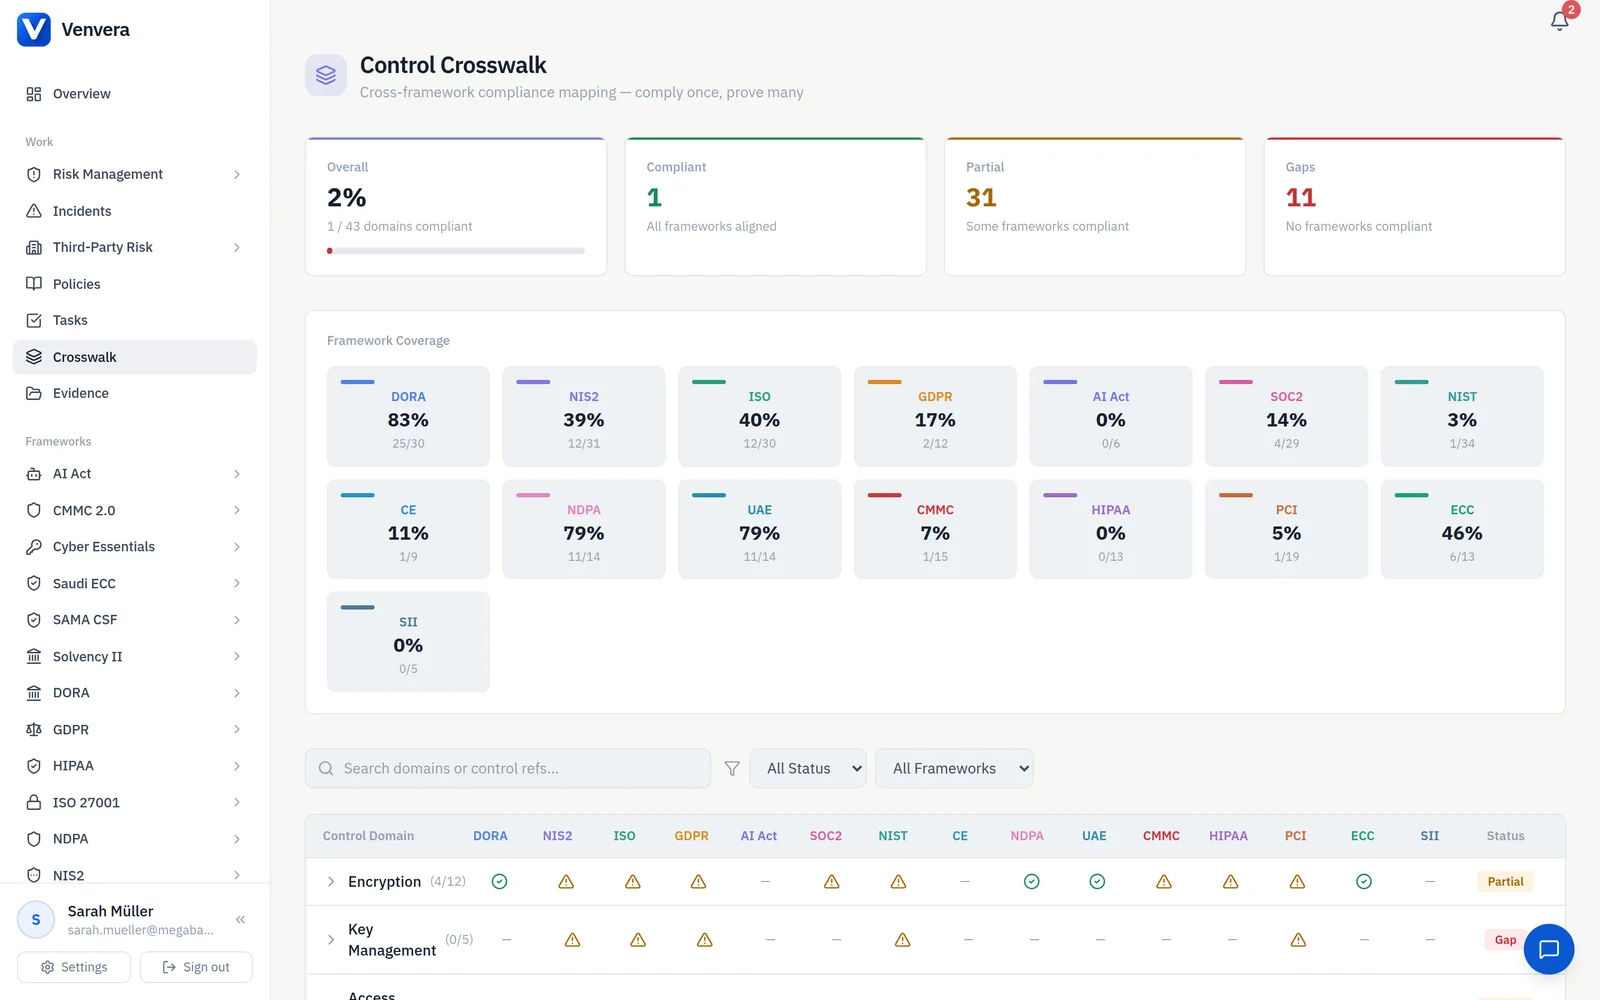
Prove one control, satisfy every framework it maps to.
One control can satisfy ISO 27001, NIS2, DORA, GDPR and more at the same time. Track implementation status, effectiveness ratings and supporting evidence for each control. Multi-framework control mapping eliminates duplicate work and gives you a single view of your security posture.
- Cross-framework control library with 150+ pre-mapped controls
- Implementation status tracking: Not Started, In Progress, Implemented, Effective
- Effectiveness ratings with evidence attachment
- Gap analysis: which risks lack adequate controls
The spreadsheet or Venvera.
Risk management questions, answered.
Turn your register into a working system.
Start with a free compliance check - see your risk posture scored against appetite in minutes.
✓ Every paid plan: audit-ready in 90 days, or your money back
10 minutes · no email to start · no credit card · yours to keep